Tuesday, November 23, 2010
Inside Job
Finally saw the documentary Inside Job. Whew! Unlike the typical movie drama, this is about reality and there's no hero to win over evil in the end. The elites prevailed. Duh!
Wednesday, November 3, 2010
October Inventory, Sold, New
 I've been continuing to capture numbers, but haven't gotten to posting in awhile. So here is the update for the end of October. The short version is that Santa Monica and Westside inventory numbers may be high enough, and the economy weak enough, to follow the path of two years ago (late 2008 into spring 2009) that brought the 20%+ drop in Santa Monica benchmark prices. You see that in the high inventory and low sales turquoise bars in the first half of the year. We'll see.


 All Westside
                 1/29     4/2    5/30     8/1    10/3   11/26
                     2/26    4/30     7/3     9/3   10/31   12/31

Bel Air-Holmby H.  91  99 109 111 111 131 133 119 116 121
Beverly Ctr.-M.M.  58  66  75  74  91  92  88  79  81  78
Beverly Hills      96 115 103 117 118 124 126 106 118 130
B.Hills P.O.      127 126 124 136 142 137 138 139 128 132
Beverlywood Vic.   31  34  36  41  50  57  57  61  60  59
Brentwood         102 115 113 129 137 127 134 125 144 131
Cheviot-R.Park '8' 21  18  20  28  27  34  31  28  33  25
Culver City        30  36  35  36  39  39  53  49  53  39
Malibu            209 215 211 226 231 242 233 237 230 226
Malibu Beach       75  70  72  76  72  84  87  84  78  78
Marina Del Rey     27  31  26  28  27  25  28  23  22  17
Pacific Palisades 106 107 122 148 148 134 140 136 142 136
Palms-Mar Vista    58  65  67  88  91  77  87  91  90  84
Playa Del Rey      14  13  17  25  23  23  29  33  33  29
Playa Vista         4   3   4   4   4   5   7   7   5   3
Santa Monica       68  74  79  87  88  81  88  88  81  90
Sunset-Hwd.Hills  214 228 231 246 259 267 278 274 283 276
Topanga            53  66  69  71  71  68  72  61  61  62
Venice             61  66  80  75  81  90  98  93  93  97
W.Hollywood Vic.   37  36  25  32  36  42  47  46  54  56
West L.A.          12  17  21  21  23  26  33  55  62  61
Westchester        49  47  48  56  58  70  70  77  79  72
Westwood-Cent.City 42  44  58  55  71  63  72  53  48  60
                  ___ ___ ___ ___ ___ ___ ___ ___ ___ ___ ___ ___

2010 Totals      1585    1745    1998    2129    2094
                     1691    1910    2038    2064    2062
2009 Totals      2027    2281    2196    2233    2034    1827
                     2205    2262    2160    2133    1979    1486
2008 Totals      1509    1694    1917    2019    2006    2128
                     1524    1846    1974    1942    2085    1822
2007 Totals      1282    1274    1457    1522    1671    1600
                     1308    1377    1483    1551    1731    1329
See 2007, 2008, and 2009 monthly totals. Santa Monica here omits Santa Monica Canyon (in City of Los Angeles but S.M. Post Office).
S&P/Case-Shiller (August) and DataQuick (September)
 Last week's August 2010 S&P/Case-Shiller appears to represent a peak and beginning of a decline in both Los Angeles and the 10-city Composite, now down 35.7% from its September 2006 peak, at December 2003 levels. The national (orange line, their original 10-city Composite) index is down 28.3% from its peak in June 2006. The Low, Middle, and High tiers are also graphed. The left column on the chart is peak to bottom; the right is peak to current month.
 The DataQuick numbers for September also appear to show a downtrend for the four counties. Los Angeles County's median was at $340K, down 38.2% from its peak in August 2007. That left Los Angeles County at November 2003, Orange County prices at October 2003, Ventura County at April 2003, and San Diego County at July 2002.
 Finally, here is the updated Los Angeles Case-Shiller index scaled with the Los Angeles DataQuick median price history (normalized Case-Shiller's January 2000 = 100). The Case-Shiller data is a month older and a three-month average.
Also see Calculated Risk on the CoreLogic 1.5% year-year price decline for August.
Thursday, July 29, 2010
S&P/Case-Shiller (May) and DataQuick (June)
 Tuesday's May 2010 S&P/Case-Shiller was an uptick for both Los Angeles and the 10-city Composite, but as a three-month average through May likely reflects the end of federal tax credits more than a rising trend.
Overall Los Angeles (including Orange County) was up 1.68% from April and 0.68% from March, down 0.70% from February and 0.67% from January, up 0.92% from December, 0.99% from November, 0.77% from October, 0.30% from September, 0.85% from August, and 1.6% from July, now down 36.2% from its September 2006 peak, at November 2003 levels. The national (orange line, their original 10-city Composite) index is down 29.6% from its peak in June 2006. The Low, Middle, and High tiers are also graphed. The left column on the chart is peak to bottom; the right is peak to current month.
 For a view ahead, this chart from Barry Ritholtz's The Big Picture yesterday, of the S&P/Case-Shiller in real dollars, projects a continued fall to long-term values.
 The DataQuick numbers for May show three of the four counties back down for the month. Los Angeles County's median was at $335K, down 39.1% from its peak in August 2007. That left Los Angeles County at September 2003, Orange County prices at October 2003, Ventura County at May 2003, and San Diego County at August 2002.
 Finally, here is the updated Los Angeles Case-Shiller index scaled with the Los Angeles DataQuick median price history (normalized Case-Shiller's January 2000 = 100). The Case-Shiller data is a month older and a three-month average; the DataQuick downtick may be a leading indicator for Case-Shiller's dirction.
As I wrote last month, in general prices continue pretty flat since mid-2009, and likely to fall again as tax credits end, interest rates rise, and more foreclosures make it to market.

Monday, July 26, 2010
90403 - 90404 - Ocean Park 90405 sales March-June
 In the first of three parts, here are Santa Monica sales for the four months from March to June, 2010, except north of Montana and Sunset Park. These reflect the frenzy of buyers trying to get into the federal tax credit; things seem to have slowed down in July.
I've featured 750 Navy Street (photo above) that originally was listed on 3/3/08 for a whopping $1.9M. It finally sold REO for $781K, a 59% reduction!
Address, bed/bath, current price (-% from orig.), orig.list date, sale date, sale price (-% from last list price)
90403
614 California, 3/1.5, $849K, 5/6/10, 6/15/10, $895K (+5%)
838 25th, 2/1, $1,195K, 2/23/10, 3/31/10, $1,385K (+16%)
1043 Centinela, 2/1, $1,459K (-7%), 1/14/10, 6/4/10, $1,450K (-1%)
824 Stanford, 4/2, $1,649K (-17%), 9/11/08, 4/1/10, $1,564K (-5%)
933 Harvard, 3/2.5, $1,849K, 1/14/10, 3/23/10, $1,849K
1147 Centinela, 5/6, $2,795K (-7%), 9/30/09, 4/7/10, $2,650K (-5%)
90404
1917 12th, 2/1, $625K (-43%), 3/1/09, 3/15/10, $625K
3024 Arizona, 2/1, $699K, 1/5/10, 6/9/10, $735K (+5%)
3011 Urban, 3/2, $749K, 3/27/10, 6/15/10, $740K (-1%)
1321 Chelsea, 2/2, $795K (-15%), 1/7/10, 6/11/10, $750K (-6%)
3014 Delaware, 3/2, $825K (-3%), 11/11/09, 5/11/10, $800K (-3%)
Ocean Park 90405
718 Marine, 1/1, $559K, 2/18/10, 6/18/10, $535K (-4%)
725 Marine, 2/1, $769K, 3/4/10, 6/10/10, $765K (-1%)
708 Raymond, 2/1.25, $785K (-8%), 4/28/09, 3/10/10, $720K (-8%)
750 Navy (photo), 2/1.5, $799K (-58%), 3/3/08, 4/21/10, $781K (-2%)
713 Bay, 2/2, $897K, 2/25/10, 6/26/10, $875K (-2%)
711 Pine, 3/2, $1,295K (-12%), 4/6/09, 6/21/10, $1,200K (-7%)
2513 3rd, 3/1.75, $1,475K, 5/10/10, 6/8/10, $1,475K
528 Ocean Park, 3/3, $2,500K (-29%), 10/15/08, 6/15/10, $2,000K (-20%)
Tuesday, July 6, 2010
June Inventory, Sold, New
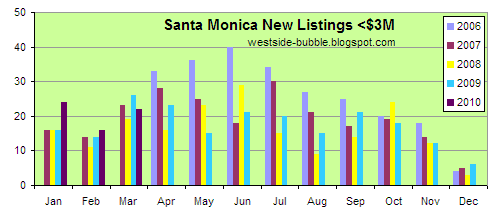
 Westside inventory has been running second-highest since 2006, below only last year's financial-meltdown levels. Santa Monica inventory below $3M has been similar until until June, when unusually-high sales (from the tax credit ending?) depleted listings. Santa Monica inventory above $3M has been slowly restoring from a very low fall 2009. New listings have been reasonably flat. See the bottom for the breakdown of the Westside totals.


 All Westside
 1/29 4/2 5/30 7/30 10/1 11/26
2/26 4/30 7/3 8/27 10/29 12/31
Bel Air-Holmby H. 91 99 109 111 111 131
Beverly Ctr.-M.M. 58 66 75 74 91 92
Beverly Hills 96 115 103 117 118 124
B.Hills P.O. 127 126 124 136 142 137
Beverlywood Vic. 31 34 36 41 50 57
Brentwood 102 115 113 129 137 127
Cheviot-R.Park '8' 21 18 20 28 27 34
Culver City 30 36 35 36 39 39
Malibu 209 215 211 226 231 242
Malibu Beach 75 70 72 76 72 84
Marina Del Rey 27 31 26 28 27 25
Pacific Palisades 106 107 122 148 148 134
Palms-Mar Vista 58 65 67 88 91 77
Playa Del Rey 14 13 17 25 23 23
Playa Vista 4 3 4 4 4 5
Santa Monica 68 74 79 87 88 81
Sunset-Hwd.Hills 214 228 231 246 259 267
Topanga 53 66 69 71 71 68
Venice 61 66 80 75 81 90
W.Hollywood Vic. 37 36 25 32 36 42
West L.A. 12 17 21 21 23 26
Westchester 49 47 48 56 58 70
Westwood-Cent.City 42 44 58 55 71 63
___ ___ ___ ___ ___ ___ ___ ___ ___ ___ ___ ___
2010 Totals 1585 1745 1998
1691 1910 2038
2009 Totals 2027 2281 2196 2233 2034 1827
2205 2262 2160 2133 1979 1486
2008 Totals 1509 1694 1917 2019 2006 2128
1524 1846 1974 1942 2085 1822
2007 Totals 1282 1274 1457 1522 1671 1600
1308 1377 1483 1551 1731 1329 See 2007, 2008, and 2009 monthly totals. Santa Monica here omits Santa Monica Canyon (in City of Los Angeles but S.M. Post Office).
Wednesday, June 30, 2010
S&P/Case-Shiller (April) and DataQuick (May)

Yesterday's April 2010 S&P/Case-Shiller was overall pretty flat trend for both Los Angeles and the 10-city Composite.
Overall Los Angeles (including Orange County) was up 0.68% from March, after being down 0.70% from February and 0.67% from January, (compared with up 0.92% from December, 0.99% from November, 0.77% from October, 0.30% from September, 0.85% from August, and 1.6% from July), now down 37.3% from its September 2006 peak, at November 2003 levels. The national (orange line, their original 10-city Composite) index is down 30.5% from its peak in June 2006.
The Low, Middle, and High tiers are again available and graphed; the high tier was almost exactly flat for the month (up a whole 0.01%). The left column on the chart is peak to bottom; the right is peak to current month.
 The DataQuick numbers for May show three of the four counties up for the month, but more from sales of higher-priced houses than price increases:
 The median price paid topped $300,000 for the first time in 20 months, largely because the ultra bargains have been drying up in the low-cost inland areas while sales have increased in the pricier coastal neighborhoods....Los Angeles County's median was at $345K, down 37.3% from its peak in August 2007. For what it's worth (given the changing mix), that left Los Angeles County at December 2003, Orange County prices at January 2004, Ventura County at May 2003, and San Diego County at August 2002.
 Finally, here is the updated Los Angeles Case-Shiller index scaled with the Los Angeles DataQuick median price history (normalized Case-Shiller's January 2000 = 100). The Case-Shiller data is a month older and a three-month average.
In general prices continue pretty flat since mid-2009, and likely to fall again as tax credits end, interest rates rise, and more foreclosures make it to market.

Wednesday, June 23, 2010
Price declines ahead ...
No, I haven't disappeared, just lots else going on that makes it hard to focus on posting here. Next week I'll post updates DataQuick and S&P/Case-Shiller updates and my Santa Monica and Westside data through June. Local inventory continues to be the second-highest I've recorded, below last year's crisis levels but above 2008.
In the meantime these two items yesterday from The Big Picture and Calculated Risk (daily must-reads for me) reinforce my expectation that we're going to see another step down in the larger economy and local real estate prices during the second half of this year.
Existing Home Sales Slide 2.2%
In the meantime these two items yesterday from The Big Picture and Calculated Risk (daily must-reads for me) reinforce my expectation that we're going to see another step down in the larger economy and local real estate prices during the second half of this year.
Existing Home Sales Slide 2.2%
We see more evidence that next leg down in Housing has begun, ...How high will Existing Home Months-of-Supply increase this summer?
We haven’t looked at the usual idiotic blatherings from the National Association of Realtors in quite some time. For shits and giggles, let’s have a gander at their latest, to see if they are still maintaining their traditional high standards of alcohol consumption.
Ahhh, the Realtor crowd rarely disappoints. The Headline — “May Shows a Continued Strong Pace for Existing-Home Sales” — reveals their inability to separate facts from wishful thinking. ...
Let’s ignore their usual foolishness, and go straight for the data: ...
Earlier I posted a graph showing the relationship of existing home months-of-supply to house prices. When months-of-supply is below 6 months, house prices are typically rising - and above 6 months-of-supply, house prices are usually falling (this isn't perfect, but it is a general guide). ...
The peak for months-of-supply was 11.2 months in 2008. And house prices? The Case-Shiller composite 20 index fell 17.2% in 2008.
We are much closer to the price bottom now than in 2008, and I don't expect that severe of a price decline. But I do expect house prices to fall in the 2nd half of 2010 and into 2011 - probably another 5% to 10% for the major house price indexes (Case-Shiller and CoreLogic). ...
Wednesday, April 28, 2010
Financial Reform commercial
Barry Ritholtz's The Big Picture blog this morning features the brilliant "A Financial Reform Commercial I Want To See" (copy and email to your senators and congressmember!):
Here is a commercial I want to see someone create, that I’d like to see go viral:
Here is a commercial I want to see someone create, that I’d like to see go viral:
The screen is dark. There is a soft heartbeat in the background
White letters appear on the screen: 1998 Glass Steagall Repeal
Voiceover: In 1998, the Glass Steagall act was repealed by Congress. Since 1932, it successfully kept banks separated from Wall Street (pause) . . . After its repeal?

(Citigroup, Countrywide, and Washington Mutual logos on screen. They shatter and collapse).
Voiceover: Major banks collapsed, causing the worse recession in generations and costing taxpayers billions.
(Heartbeat gets a little louder and quicker).
White letters Commodity Future Modernization Act of 2000
Voiceover: In 2000, Congress passed the Commodity Future Modernization Act. It made one group of financial instruments — Derivatives — completely free from all regulation (pause) . . . The result?
(AIG logo appears, explodes)
Voiceover: The AIG collapse cost taxpayers $185 billion in bailouts.
(Heartbeat is now louder and faster).
Letters: 2004 SEC permits Wall Street to dramatically increase its leverage
Voiceover: In 2004, the 5 biggest investment houses in the country got permission to lever up (pause) . . . The result?
(Logos appear; Bear Stearns, Lehman blow up; Merrill Lynch turns gray and keels over; Goldman Sachs, Morgan Stanley spiderweb crack — but don’t fall)
Voiceover: Lehman & Bear — gone. Taxpayers spent billions helping Bank America rescue Merrill Lynch. Goldman and Morgan became bank holding companies.
(Heartbeat is very rapid and loud).
More white letters: 2010 Financial Reform legislation . . . is . . . blocked
(heartbeat stops . . . screen fades to white light)
Voiceover: Partisan fighting in Congress is blocking financial reform . . . but YOU can help move it forward. (heartbeat starts again) Tell your congressman and senator to stop listening to Wall St lobbyists, and pass financial reform NOW.
Because the last thing any of us wants is another financial heart attack.
Lettering: Please pass financial reform . . . or else.
(heartbeat stops, letter replaced with flatlined EKG)
Lettering: Call your congressman today (phone number)


Tuesday, April 27, 2010
S&P/Case-Shiller and DataQuick (April)
 Today's February 2010 S&P/Case-Shiller turned down slightly for Los Angeles and continued down for the 10-city Composite.
Overall Los Angeles (including Orange County) was down 0.67% from January (compared with up 0.92% from December, 0.99% from November, 0.77% from October, 0.30% from September, 0.85% from August, and 1.6% from July), now down 37.3% from its September 2006 peak, at November 2003 levels. The national (orange line, their original 10-city Composite) index is down 30.7% from its peak in June 2006.
The Low, Middle, and High tiers are no longer available without registration and were last reported here with the August update. The left column on the chart is peak to bottom; the right is peak to current month. In contrast, the DataQuick numbers for March show all four counties were up for the month after previous monthly drops. This seems likely due to the expiring federal tax credit.
Los Angeles County's median was back to $329K, down 40.2% from its peak in August 2007. Volumes were up 13% year-to-year from March 2009.
That left Los Angeles County and Orange County prices at July 2003, Ventura County at April 2003, and San Diego County at July 2002.
Finally, here is the updated Los Angeles Case-Shiller index scaled with the Los Angeles DataQuick median price history (normalized Case-Shiller's January 2000 = 100). The Case-Shiller data is a month older and a three-month average.
In general prices look pretty flat since mid-2009, and likely to fall again as tax credits end, interest rates rise, and more foreclosures make it to market.
Monday, April 5, 2010
S&P/Case-Shiller and DataQuick (March)

Due to popular demand I'll catch up with the S&P/Case-Shiller and DataQuick numbers released last month. The January 2010 S&P/Case-Shiller was again up slightly for Los Angeles but down for the 10-city Composite.
Overall Los Angeles (including Orange County) was up 0.92% from December (compared with 0.99% from November, 0.77% from October, 0.30% from September, 0.85% from August, and 1.6% from July), now down 36.9% from its September 2006 peak, at December 2003 levels. The national (orange line, their original 10-city Composite) index is down 30.2% from its peak in June 2006.
The Low, Middle, and High tiers are no longer available without registration and were last reported here with the August update. The left column on the chart is peak to bottom; the right is peak to current month.
In contrast, the DataQuick February numbers for February show all but San Diego County were down for the month again.
Los Angeles County's median was back to $325K, down 42.7% from its peak in August 2007. Volumes were up 10% year-to-year from February 2009.
That left Los Angeles County and Orange County prices at June 2003, Ventura County at February 2003, and San Diego County at June 2002.
Finally, here is the updated Los Angeles Case-Shiller index scaled with the Los Angeles DataQuick median price history (normalized Case-Shiller's January 2000 = 100). The Case-Shiller data is a month older and a three-month average. Is DataQuick the better indicator of a falling trend here, or is it too affected by sales mix?
Sunday, April 4, 2010
March Inventory, Sold, New
 Like January and February, Santa Monica inventory below $3M and Westside overall inventory is running a little higher for March than two years ago (2008), but below last year's high financial-meltdown levels. Santa Monica >$3M is a bit lower. See the bottom for the breakdown of the Westside totals.
Santa Monica <$3M sales are also similar to 2008. New listings (that don't include relistings) are at a typical level. Conversely >$3M sales have been moribund (1 in January, 0 in February, 0 in March, although 4 are in escrow), and new listings (again excluding relistings) are the lowest in four years.


All Westside
                 1/29     4/2    5/28    7/30    10/1   11/26
                     2/26    4/30     7/2    8/27   10/29   12/31

Bel Air-Holmby H.  91  99 109
Beverly Ctr.-M.M.  58  66  75
Beverly Hills      96 115 103
B.Hills P.O.      127 126 124
Beverlywood Vic.   31  34  36
Brentwood         102 115 113
Cheviot-R.Park '8' 21  18  20
Culver City        30  36  35
Malibu            209 215 211
Malibu Beach       75  70  72
Marina Del Rey     27  31  26
Pacific Palisades 106 107 122
Palms-Mar Vista    58  65  67
Playa Del Rey      14  13  17
Playa Vista         4   3   4
Santa Monica       68  74  79
Sunset-Hwd.Hills  214 228 231
Topanga            53  66  69
Venice             61  66  80
W.Hollywood Vic.   37  36  25
West L.A.          12  17  21
Westchester        49  47  48
Westwood-Cent.City 42  44  58
                  ___ ___ ___ ___ ___ ___ ___ ___ ___ ___ ___ ___

2010 Totals      1585    1745
                     1691
2009 Totals      2027    2281    2196    2233    2034    1827
                     2205    2262    2160    2133    1979    1486
2008 Totals      1509    1694    1917    2019    2006    2128
                     1524    1846    1974    1942    2085    1822
2007 Totals      1282    1274    1457    1522    1671    1600
                     1308    1377    1483    1551    1731    1329
See 2007, 2008, and 2009 monthly totals. Santa Monica here omits Santa Monica Canyon (in City of Los Angeles but S.M. Post Office).
Subscribe to:
Posts (Atom)