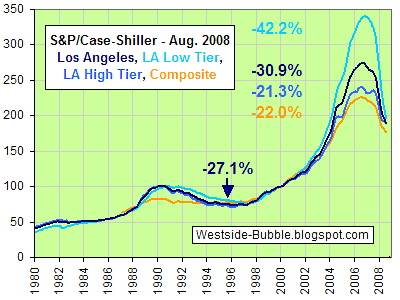
 Today's August 2008 S&P/Case-Shiller numbers continued down, now 30.9% from its peak in September 2006, and a little steeper this month than the last two.
By month that's 1.8% from July, 1.6% from June, 1.4% from May, 1.9% from April, 2.2% from March, 3.6% from February, 4.3% from January, 3.7% from December 2007, 3.6% from November, 3.6% from October, 2.1% from September and 1.3% from August. The national (orange line, their original 10-city Composite) index is down 22.0% from its peak in June 2006.
Besides the original city index they have each city broken into Low, Middle, and High tiers (Under $380,142, $380,142 - $572,673, and Over $572,673; updated for August). Los Angeles' Low Tier rose the most and has fallen back the most so far from its November 2006 peak, 42.2%. The High Tier rose the least and plateaued for awhile before falling more steeply, now down another .9% to 21.3% from its June 2006 peak.
It's also interesting that compared with DataQuick's median prices, although DataQuick's peak was a year later, the total fall is similar (34.5% through September), and both have returned to spring 2004 prices.
I conjectured that south-of-Washington prices could be headed for 2004 levels, but we won't know until those two houses close. Recent sales below $1M on Ashland and Hill (plus 1645 Ashland, 10/23/08, $975K) in Sunset Park may also indicate 2004 prices.
Tuesday, October 28, 2008
August S&P/Case-Shiller
Subscribe to:
Post Comments (Atom)
16 comments:
Thanks for the great blog and graphics.
What's amazing is that prices are STILL out of whack by any measure, despite the recent dramatic price reductions and the onset of the "great financial panic" since the Great Depression.
The appreciation between 2000 and spring 2004 of nearly 100% is crazy.
Assuming 3.5% annual appreciation trend line (as was approx experienced between 1980-2000), prices would need to revert to a historically/quantitatively defensible level.
So we only have another 21-32% price reductions (131-150 in terms of chart index) from current levels to go!
Keep in mind, the downside tends to overshoot. We could roll back to the late 90s...
when did 90402 land peak and how far down are we from the peak in 90402 land
latesummer is so boring. yeah, yeah, yeah, we know.
It will be at 1928 prices soon if we wait.
what do the latest transactions imply ? what is the price of land on a standard 7500 sq foot lot on best streets in 90402 and what is the price of that same lot on the best sfr streets in 90403?
according to latesummer we will finally be able to buy in SM for $250,000. Thank gosh for your prediction. Here we go 1920s..
Same tapes..do you have any other tunes?
i appreciate late summer
it is good to have him here
if any of the raging bulls on this site put in as much work as late summer they would get the props but they don't
SM is made up of neighborhoods . certain neighborhoods will do better than others in this coming real estate crash
the lots in 90402 were 900k back in 1989
a vacant lot going up from 900k to 1.9 million over 20 years doesnt seem excessive
that is only four percent a year
and 90402 is safer today than it was in 1989
"the lots in 90402 were 900k back in 1989"
Right, at close to another peak in the LA market (check the graph these posts are referencing). Bad data point for comparison, IMHO.
The point is, who knows? It's fun and everything to conjecture (and do the oh-so-2000s thing of bashing people's opinions anonymously), but where we end up is anyone's guess. I do agree with the poster who said that, as with the upside, cycles overcorrect on the downside.
loan resets
lost jobs
foreclosures
yada-yada-yada
1846 prices coming your way
by late Summer 2010.
Um... is it just me or does this graph make it look like Case-Shiller is back in line with long term trends?
you are correct
we are back in line
Case Shiller shows what exactly? Where is the data that shows me when I can afford a house? In Santa Monica? 'cause i've been lookin' and its not that much betta' out there.
You can buy pure fixer crap or loads of condos. Gee, did the bubble pass me by?
Case shiller may overshoot, but it does appears that we are back in line with long term trends. I for one am shocked that we haven't seen vastly more movement in the local market. Time will tell.
yes the index is back to trend line
but santa monica is not back at trend
either SM is at a permanently higher plateu or sm has yet to fall
it is the battle of the bulls vs bears
Do you guys know what a trendline looks like? We are not back to the trendline. When you fit a line to that data it would be at about 150 on the chart shown on this site. When I use the raw data and fit a line it needs to drop another 22% or so.
Post a Comment