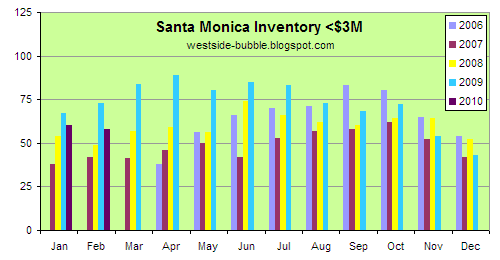
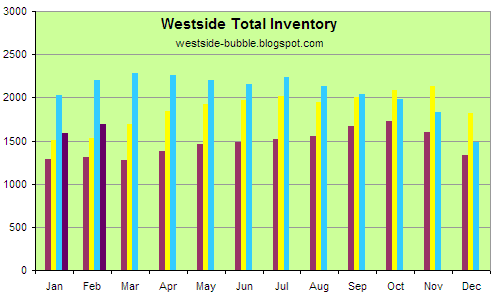
 Like January, Santa Monica inventory below $3M and Westside overall inventory is running a higher than two years ago (2008), but below last year's high financial-meltdown levels. Santa Monica >$3M is a bit lower. See the bottom for the breakdown of the Westside totals.
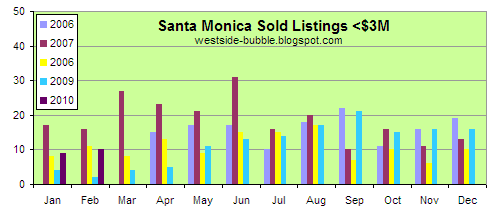
Santa Monica <$3M sales are similar to 2008, but new listings (that don't include relistings) are at record levels. Conversely >$3M sales are moribund (1 in January, 0 in February), and new listings (again excluding relistings) are the lowest in four years.


 All Westside
                 1/29     4/2    5/28    7/30    10/1   11/26
                     2/26    4/30     7/2    8/27   10/29   12/31

Bel Air-Holmby H.  91  99
Beverly Ctr.-M.M.  58  66
Beverly Hills      96 115
B.Hills P.O.      127 126
Beverlywood Vic.   31  34
Brentwood         102 115
Cheviot-R.Park '8' 21  18
Culver City        30  36
Malibu            209 215
Malibu Beach       75  70
Marina Del Rey     27  31
Pacific Palisades 106 107
Palms-Mar Vista    58  65
Playa Del Rey      14  13
Playa Vista         4   3
Santa Monica       68  74
Sunset-Hwd.Hills  214 228
Topanga            53  66
Venice             61  66
W.Hollywood Vic.   37  36
West L.A.          12  17
Westchester        49  47
Westwood-Cent.City 42  44
                  ___ ___ ___ ___ ___ ___ ___ ___ ___ ___ ___ ___

2010 Totals      1585
                     1691
2009 Totals      2027    2281    2196    2233    2034    1827
                     2205    2262    2160    2133    1979    1486
2008 Totals      1509    1694    1917    2019    2006    2128
                     1524    1846    1974    1942    2085    1822
2007 Totals      1282    1274    1457    1522    1671    1600
                     1308    1377    1483    1551    1731    1329
See 2007, 2008, and 2009 monthly totals. Santa Monica here omits Santa Monica Canyon (in City of Los Angeles but S.M. Post Office).
2 comments:
Thanks for updating the #s!!!
Great to have facts amongst all the noise and uncertainty.
If anyone can understand your numerical mumbo jumbo, he/she is a mathematical genius.
Suggest you present the figures in a readable columns.
Post a Comment