 Catching up with six months of Santa Monica sales records, this post will begin with Sunset Park sales from September 2009 to February 2010. (I'll save everyone's favorite - 90402 - for last.) They're in order of final listing price, broken at $1 million. Decreases over 10% and listing dates before 2009 are colored red; but you see that most sellers priced more reasonably and sold in not too long.
I'll highlight the 2 bed / 1 bath 940 SF house on a 6,000 SF lot at 2405 29th St. as the lowest-priced not-awful condition or location house sold in Sunset Park. Listed 10/15/09 for $849K, reduced twice to $759K, and sold 2/25/10 for $680K, it's a tiny house on a 40-foot lot, but under $700K.
"PRICE REDUCED $90,000! A SANTA MONICA TRADITIONAL PERFECT FOR THE FIRST TIME HOME BUYER WITH PLENTY OF ROOM TO GROW! SITUATED IN THE GRANT ELEMENTARY SCHOOL DISTRICT. CLOSE TO ALL THE SHOPS, CAFES AND RESTAURANTS."
Address, bed/bath, current price (-% from orig.), orig.list date, sale date, sale price (-% from last list price)
819 Pier, 2/1, $550K (-49%), 5/9/08, 12/18/09, $560K (+2%)
2524 Cloverfield, 2/1, $699K, 9/10/09, 11/17/09, $695K (-1%)
1108 Ocean Park, 3/2, $746K (-25%), 2/23/09, 11/24/09, $727K (-3%)
2405 29th (photo), 2/1, $759K (-11%), 10/15/09, 2/25/10, $680K (-10%)
2312 27th, 3/2, $800K, 10/30/09, 12/4/09, $913K (+14%)
2002 Ashland, 2/1, $849K, 8/3/09, 9/25/09, $828K (-2%)
2350 Pier, 3/1.75, $849K, 10/27/09, 12/11/09, $890K (+5%)
1733 Sunset, 3/2, $888K, 11/12/09, 1/7/10, $901K (+1%)
1325 Grant, 3/2, $889K (-6%), 2/5/09, 9/9/09, $802K (-10%)
2212 Pier, 3/2, $945K (-16%), 4/30/09, 10/8/09, $850K (-10%)
3031 16th, 4/2, $949K, 9/20/09, 11/5/09, $928K (-2%)
2251 26th, 3/2, $989K, 9/9/09, 10/16/09, $979K (-1%)
1601 Marine, 3/2, $999K (-13%), 3/18/09, 11/5/09, $950K (-5%)
2423 31st, 3/2, $1,047K (-4%), 8/18/09, 11/25/09, $985K (-6%)
1003 Pier, 3/2, $1,050 (-9%), 6/10/09, 11/25/09, $915K (-13%)
1629 Wellesley, 3/1.75, $1,039K (-5%), 5/6/09, 9/15/09, $1,025K (-1%)
1225 Grant, 3/2, $1,046K (-25%), 4/3/08, 9/9/09, $1,040K (-1%)
812 Ashland, 3/2, $1,100K, 8/17/09, 10/27/09, $1,100K
1337 Sunset, 3/2.5, $1,150K (-11%), 6/22/09, 10/20/09, $1,060K (-8%)
2452 21st, 4/3, $1,175K (-6%), 9/16/09, 11/12/09, $1,110K (-6%)
2111 Pearl, 4/3, $1,189K, 7/29/09, 9/15/09, $1,250K (+5%)
3019 Linda, 2/2, $1,249K (-7%), 8/19/09, 11/30/09, $1,249K
2254 21st, 3/2.5, $1,250K, 9/3/09, 12/17/09, $1,088K (-13%)
1309 Cedar, 3/2, $1,279K, 8/8/09, 10/28/09, $1,250K (-2%)
2602 25th, 4/2, $1,348K, 8/27/09, 10/9/09, $1,325K (-2%)
1745 Wellesley, 4/3, $1,395K (-18%), 5/28/09, 12/17/09, $1,350K (-3%)
1710 Ashland, 3/3, $1,395K (-14%), 7/15/08, 1/26/10, $1,383K (-1%)
2208 Ashland, 2/2, $1,399K (-3%), 2/4/09, 9/28/09, $1,380K (-1%)
1208 Pacific, 3/1.75, $1,429K, 7/10/09, 9/8/09, $1,375K (-4%)
1352 Hill, 3/3, $1,495K (-6%), 5/1/09, 10/13/09, $1,425K (-5%)
2272 26th, 4/4, $1,499K (-20%), 10/29/09, 2/17/10, $1,435K (-4%)
1611 Sunset, 3/3, $1,699K (-21%), 1/30/08, 9/18/09, $1,605K (-6%)
1024 Pine, 5/3, $1,850K (-5%), 4/30/09, 9/1/09, $1,750K (-5%)
2330 21st, 5/3, $1,950K, 7/18/09, 9/12/09, $1,850K (-5%)
Sunday, February 28, 2010
Sunset Park 90405 sales Sep-Feb
Saturday, February 27, 2010
February Inventory, Sold, New
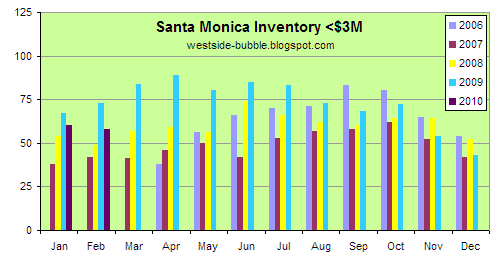
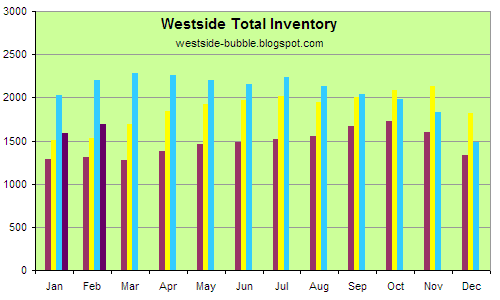
 Like January, Santa Monica inventory below $3M and Westside overall inventory is running a higher than two years ago (2008), but below last year's high financial-meltdown levels. Santa Monica >$3M is a bit lower. See the bottom for the breakdown of the Westside totals.
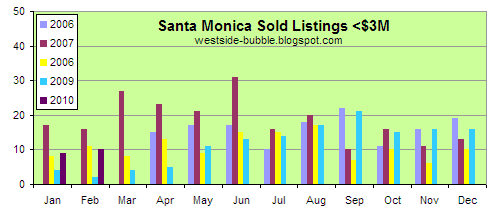
Santa Monica <$3M sales are similar to 2008, but new listings (that don't include relistings) are at record levels. Conversely >$3M sales are moribund (1 in January, 0 in February), and new listings (again excluding relistings) are the lowest in four years.


 All Westside
                 1/29     4/2    5/28    7/30    10/1   11/26
                     2/26    4/30     7/2    8/27   10/29   12/31

Bel Air-Holmby H.  91  99
Beverly Ctr.-M.M.  58  66
Beverly Hills      96 115
B.Hills P.O.      127 126
Beverlywood Vic.   31  34
Brentwood         102 115
Cheviot-R.Park '8' 21  18
Culver City        30  36
Malibu            209 215
Malibu Beach       75  70
Marina Del Rey     27  31
Pacific Palisades 106 107
Palms-Mar Vista    58  65
Playa Del Rey      14  13
Playa Vista         4   3
Santa Monica       68  74
Sunset-Hwd.Hills  214 228
Topanga            53  66
Venice             61  66
W.Hollywood Vic.   37  36
West L.A.          12  17
Westchester        49  47
Westwood-Cent.City 42  44
                  ___ ___ ___ ___ ___ ___ ___ ___ ___ ___ ___ ___

2010 Totals      1585
                     1691
2009 Totals      2027    2281    2196    2233    2034    1827
                     2205    2262    2160    2133    1979    1486
2008 Totals      1509    1694    1917    2019    2006    2128
                     1524    1846    1974    1942    2085    1822
2007 Totals      1282    1274    1457    1522    1671    1600
                     1308    1377    1483    1551    1731    1329
See 2007, 2008, and 2009 monthly totals. Santa Monica here omits Santa Monica Canyon (in City of Los Angeles but S.M. Post Office).
Wednesday, February 24, 2010
S&P/Case-Shiller and DataQuick
 Yesterday's December 2009 S&P/Case-Shiller the uptick was up slightly for Los Angeles but turned down for the 10-city Composite. Overall Los Angeles (including Orange County) was up 0.99% from November (compared with 0.77% from October, 0.30% from September, 0.85% from August, and 1.6% from July), now down 37.4% from its September 2006 peak, at November 2003 levels. The national (orange line, their original 10-city Composite) index is down 30.1% from its peak in June 2006.
The Low, Middle, and High tiers are no longer available without registration and were last reported here with the August update. The left column on the chart is peak to bottom; the right is peak to current month.
Following are the DataQuick numbers for January from earlier this month, showing that all but Ventura County's (which was flat) median prices were down for the month. Los Angeles County's median was back to $325K, down 40.9% from its peak in August 2007. Volumes were up 15% year-to-year from January 2009. (December DataQuick post)
That left Los Angeles County and Orange County prices at July 2003, Ventura County at March 2003, and San Diego County at April 2002. Finally, here is the updated Los Angeles Case-Shiller index scaled with the Los Angeles DataQuick median price history (normalized Case-Shiller's January 2000 = 100).