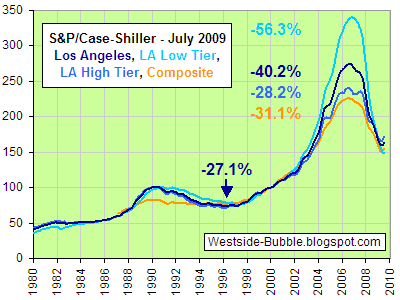
 Today's July 2009 S&P/Case-Shiller update showed more of an uptick. Overall Los Angeles (including Orange County) was up 2% from June, and is now down 40.2% from its September 2006 peak, back to September 2003 levels. The national (orange line, their original 10-city Composite) index is down 31.1% from its peak in June 2006.
Besides the original city index they have each city broken into Low, Middle, and High tiers (Under $282,535, $282,535 - $457,807, and Over $457,807; updated for July).
Have we passed the bottom? I don't think so. First, although the Case-Shiller is smoothed, it has still had ups and downs within a larger trend. Notice the dip in April 1991 and rebound in August 1991, before it continued down four more years. The fundamentals are that many houses have yet to hit the market.
Second, our Westside appears lagging the Case-Shiller for Los Angeles, as in my North of Montana Index two recent sales at $1.6M. It has another year to go to hit my projection of 2003 prices in 2010, but is consistent with Case-Shiller's reversion to 2003 prices. Finally, I wondered what it would look like to superimpose the Los Angeles Case-Shiller index with the Los Angeles DataQuick median price history. I normalized DataQuick to Case-Shiller's January 2000 = 100 to get this graph. DataQuick peaked later and higher, and bottomed sooner, showing how the mix of houses sold affects the median price. (I know, I didn't post DataQuick for August; here's July's.)
Tuesday, September 29, 2009
July S&P/Case-Shiller
Subscribe to:
Post Comments (Atom)
8 comments:
"Westside appears lagging the Case-Shiller for Los Angeles"
Funny - 2 years ago, when CS was going down, you would have been crucified for pointing out that certain areas are going against the trend or are "different".
Now, as the CS is going up, "its different here" is the rallying cry of the remaining doomers!
Nonesense, the lag has always been cited.
Nonesense, the lag has always been cited.
Not in the early days it wasnt. I remember back in 08, people were spending an inordinate amount of time trying to show why when CS said LA was down 20-30%, Westside was down that much too, we just couldnt see it for some reason.
I think we have already seen a plunge North of Montana - teardowns that used to sell for 2.1 million are today selling for 1.6 million
that is 500 thousand down or almost a 25% plunge.
The crash has happened North of Montana. The neighborhoods that have NOT crashed are the marginal West Side hoods like Mar Vista, Palms and Culver City
The higher tier is now $475k, so includes what used to be the mid tier. It's hard to know what is going on in the upper price end if so much is in the mix.
Follow the rentals. A couple of block from where I rent in Westwood there is a nice rental house. Two years ago it was going for $5,200 per month. It went on and off the rental market a couple of times. Each time it became vacant I called and the rent was a little lower. Now it's on Westside rentals for 4,750 and it's been empty for months. Cassiopeia.
Can you give us more information?
Most people consider Westwood North of Wilshire to be much better than Westwood South of Wilshire. Which hood is the house in and how big is the house?
anonymous 5:53. This is south of Wilshire, one block north of Santa Monica. Corner of Eastborne and Fairburn.
Post a Comment