
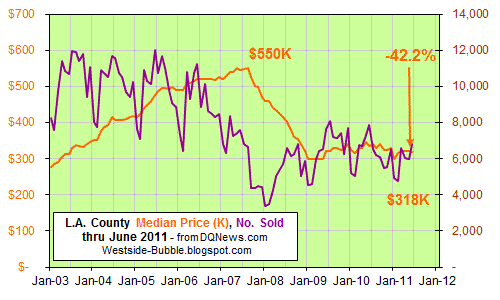


 Here are the year-end 2010 Inventory, Sold, and New listings numbers, plus January 2011. I keep the counts going, but haven't gotten around to posting them very often. To make them simpler I've also dropped New listings for 2011.
The housing bubble is not new news anymore, but its effects aren't over yet and I want to keep this statistical record going.
So where are we? So far the latter part of 2010 and beginning of 2011 are looking pretty close to the year before, when prices neither rose nor fell. We'll see how this spring plays out.


 All Westside
1/29 4/2 5/30 8/1 10/3 11/26 1/28
2/26 4/30 7/3 9/3 10/31 12/31
Bel Air-Holmby H. 91 99 109 111 111 131 133 119 116 121 111 100 113
Beverly Ctr.-M.M. 58 66 75 74 91 92 88 79 81 78 73 56 63
Beverly Hills 96 115 103 117 118 124 126 106 118 130 117 91 96
B.Hills P.O. 127 126 124 136 142 137 138 139 128 132 120 102 119
Beverlywood Vic. 31 34 36 41 50 57 57 61 60 59 48 38 43
Brentwood 102 115 113 129 137 127 134 125 144 131 116 86 89
Cheviot-R.Park '8' 21 18 20 28 27 34 31 28 33 25 25 19 26
Culver City 30 36 35 36 39 39 53 49 53 39 43 40 37
Malibu 209 215 211 226 231 242 233 237 230 226 206 177 202
Malibu Beach 75 70 72 76 72 84 87 84 78 78 79 73 82
Marina Del Rey 27 31 26 28 27 25 28 23 22 17 16 16 20
Pacific Palisades 106 107 122 148 148 134 140 136 142 136 124 94 108
Palms-Mar Vista 58 65 67 88 91 77 87 91 90 84 60 56 64
Playa Del Rey 14 13 17 25 23 23 29 33 33 29 18 16 17
Playa Vista 4 3 4 4 4 5 7 7 5 3 3 2 2
Santa Monica 68 74 79 87 88 81 88 88 81 90 73 58 71
Sunset-Hwd.Hills 214 228 231 246 259 267 278 274 283 276 245 213 229
Topanga 53 66 69 71 71 68 72 61 61 62 56 55 63
Venice 61 66 80 75 81 90 98 93 93 97 86 71 77
W.Hollywood Vic. 37 36 25 32 36 42 47 46 54 56 50 37 36
West L.A. 12 17 21 21 23 26 33 55 62 61 60 29 42
Westchester 49 47 48 56 58 70 70 77 79 72 65 48 60
Westwood-Cent.City 42 44 58 55 71 63 72 53 48 60 37 32 36
___ ___ ___ ___ ___ ___ ___ ___ ___ ___ ___ ___ ___
2010 Totals 1585 1745 1998 2129 2094 1831 1695
1691 1910 2038 2064 2062 1509
2009 Totals 2027 2281 2196 2233 2034 1827
2205 2262 2160 2133 1979 1486
2008 Totals 1509 1694 1917 2019 2006 2128
1524 1846 1974 1942 2085 1822
2007 Totals 1282 1274 1457 1522 1671 1600
1308 1377 1483 1551 1731 1329  See 2007, 2008, and 2009 monthly totals. Santa Monica here omits Santa Monica Canyon (in City of Los Angeles but S.M. Post Office).
 Today's November 2010 S&P/Case-Shiller continues the small secondary peak and decline in both Los Angeles and the 10-city Composite, now down 36.7% from its September 2006 peak, at December 2003 levels. The national (orange line, their original 10-city Composite) index is down 30.3% from its peak in June 2006. The Low, Middle, and High tiers are also graphed. The left column on the chart is peak to bottom; the right is peak to current month.
 The DataQuick numbers for January also show a downtrend for the four counties. Los Angeles County's median was at $340K, down 40.0% from its peak in August 2007. That left Los Angeles County at July 2003, Orange County prices at June 2003, Ventura County at March 2003, and San Diego County at July 2002.
 Finally, here is the updated Los Angeles Case-Shiller index scaled with the Los Angeles DataQuick median price history (normalized Case-Shiller's January 2000 = 100). The Case-Shiller data is a month older and a three-month average.
 I've been continuing to capture numbers, but haven't gotten to posting in awhile. So here is the update for the end of October. The short version is that Santa Monica and Westside inventory numbers may be high enough, and the economy weak enough, to follow the path of two years ago (late 2008 into spring 2009) that brought the 20%+ drop in Santa Monica benchmark prices. You see that in the high inventory and low sales turquoise bars in the first half of the year. We'll see.


 All Westside
                 1/29     4/2    5/30     8/1    10/3   11/26
                     2/26    4/30     7/3     9/3   10/31   12/31

Bel Air-Holmby H.  91  99 109 111 111 131 133 119 116 121
Beverly Ctr.-M.M.  58  66  75  74  91  92  88  79  81  78
Beverly Hills      96 115 103 117 118 124 126 106 118 130
B.Hills P.O.      127 126 124 136 142 137 138 139 128 132
Beverlywood Vic.   31  34  36  41  50  57  57  61  60  59
Brentwood         102 115 113 129 137 127 134 125 144 131
Cheviot-R.Park '8' 21  18  20  28  27  34  31  28  33  25
Culver City        30  36  35  36  39  39  53  49  53  39
Malibu            209 215 211 226 231 242 233 237 230 226
Malibu Beach       75  70  72  76  72  84  87  84  78  78
Marina Del Rey     27  31  26  28  27  25  28  23  22  17
Pacific Palisades 106 107 122 148 148 134 140 136 142 136
Palms-Mar Vista    58  65  67  88  91  77  87  91  90  84
Playa Del Rey      14  13  17  25  23  23  29  33  33  29
Playa Vista         4   3   4   4   4   5   7   7   5   3
Santa Monica       68  74  79  87  88  81  88  88  81  90
Sunset-Hwd.Hills  214 228 231 246 259 267 278 274 283 276
Topanga            53  66  69  71  71  68  72  61  61  62
Venice             61  66  80  75  81  90  98  93  93  97
W.Hollywood Vic.   37  36  25  32  36  42  47  46  54  56
West L.A.          12  17  21  21  23  26  33  55  62  61
Westchester        49  47  48  56  58  70  70  77  79  72
Westwood-Cent.City 42  44  58  55  71  63  72  53  48  60
                  ___ ___ ___ ___ ___ ___ ___ ___ ___ ___ ___ ___

2010 Totals      1585    1745    1998    2129    2094
                     1691    1910    2038    2064    2062
2009 Totals      2027    2281    2196    2233    2034    1827
                     2205    2262    2160    2133    1979    1486
2008 Totals      1509    1694    1917    2019    2006    2128
                     1524    1846    1974    1942    2085    1822
2007 Totals      1282    1274    1457    1522    1671    1600
                     1308    1377    1483    1551    1731    1329
See 2007, 2008, and 2009 monthly totals. Santa Monica here omits Santa Monica Canyon (in City of Los Angeles but S.M. Post Office).
 Last week's August 2010 S&P/Case-Shiller appears to represent a peak and beginning of a decline in both Los Angeles and the 10-city Composite, now down 35.7% from its September 2006 peak, at December 2003 levels. The national (orange line, their original 10-city Composite) index is down 28.3% from its peak in June 2006. The Low, Middle, and High tiers are also graphed. The left column on the chart is peak to bottom; the right is peak to current month.
 The DataQuick numbers for September also appear to show a downtrend for the four counties. Los Angeles County's median was at $340K, down 38.2% from its peak in August 2007. That left Los Angeles County at November 2003, Orange County prices at October 2003, Ventura County at April 2003, and San Diego County at July 2002.
 Finally, here is the updated Los Angeles Case-Shiller index scaled with the Los Angeles DataQuick median price history (normalized Case-Shiller's January 2000 = 100). The Case-Shiller data is a month older and a three-month average.
Also see Calculated Risk on the CoreLogic 1.5% year-year price decline for August.


